
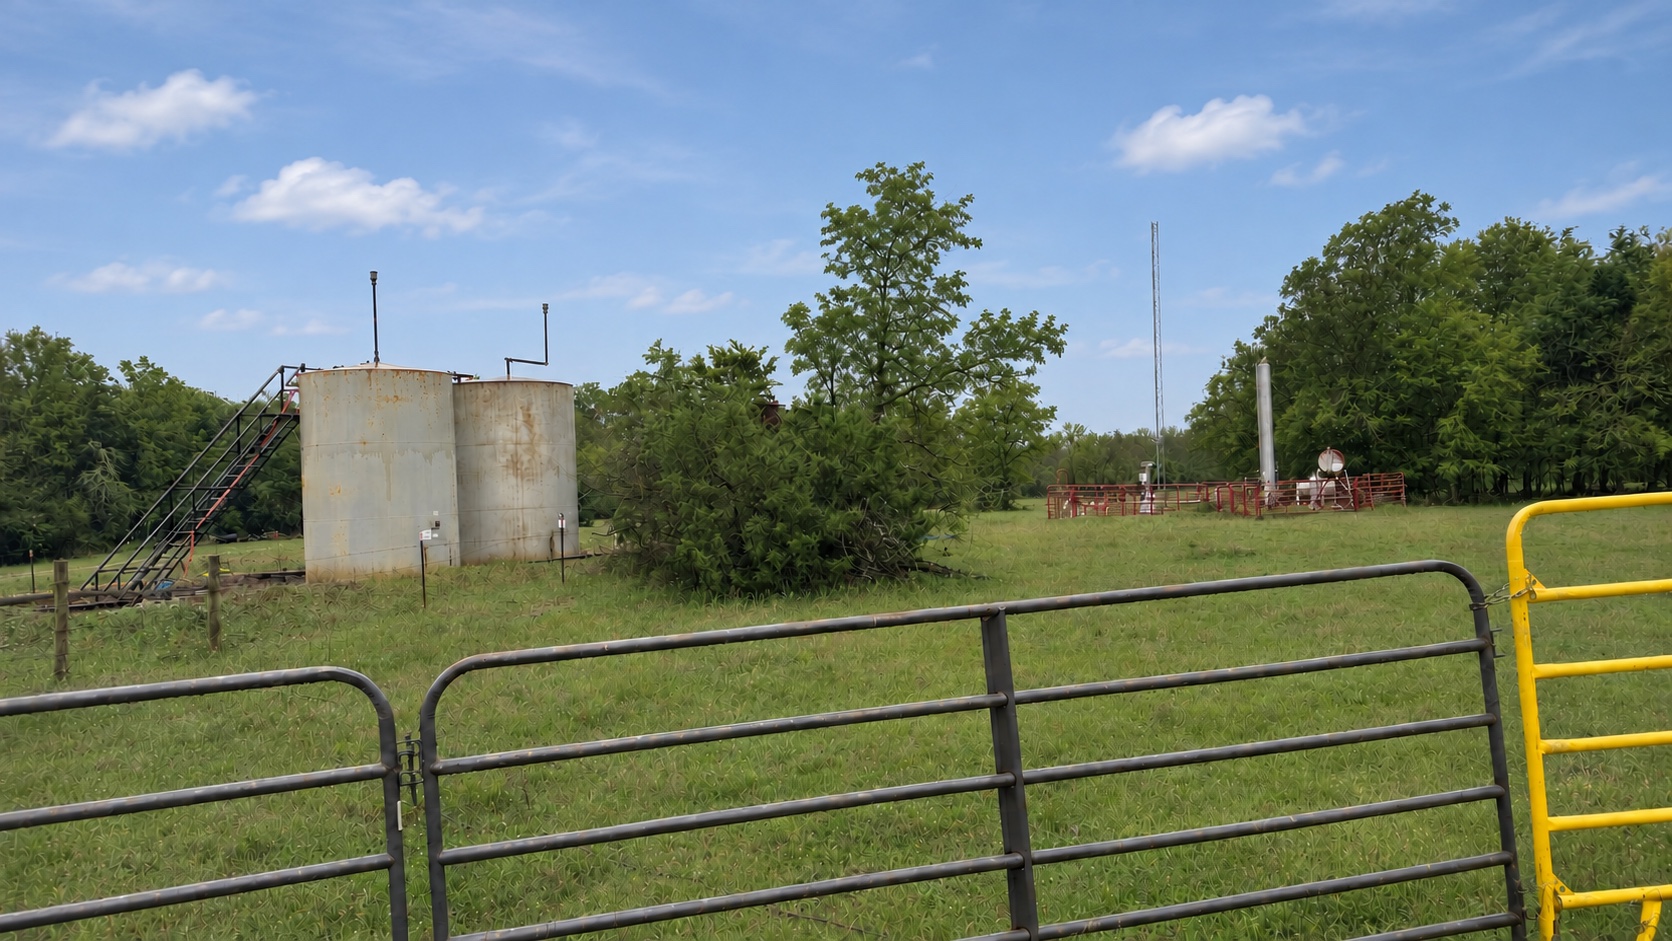
Kirvin / North Mann · East Texas
An established field.
A new chapter.
Fourteen wellbores. Infrastructure in place. A redevelopment plan that starts with what is already here—and builds from the wellbore up.
AP Operating · Independent Texas operatorFreestone County, Texas
From the field to the marketTwo products.
Two products.
Established destinations.
 200+ Mcf/dayCurrent field gas production
Kirvin / North Mann
14 wellbores · 5.13 miles of gathering
14 wellbores · 5.13 miles of gathering
Natural gasSold to
 Energy
Transfer
Crude oilSold to

The place · Freestone County, Texas
Come closer.
See what connects.
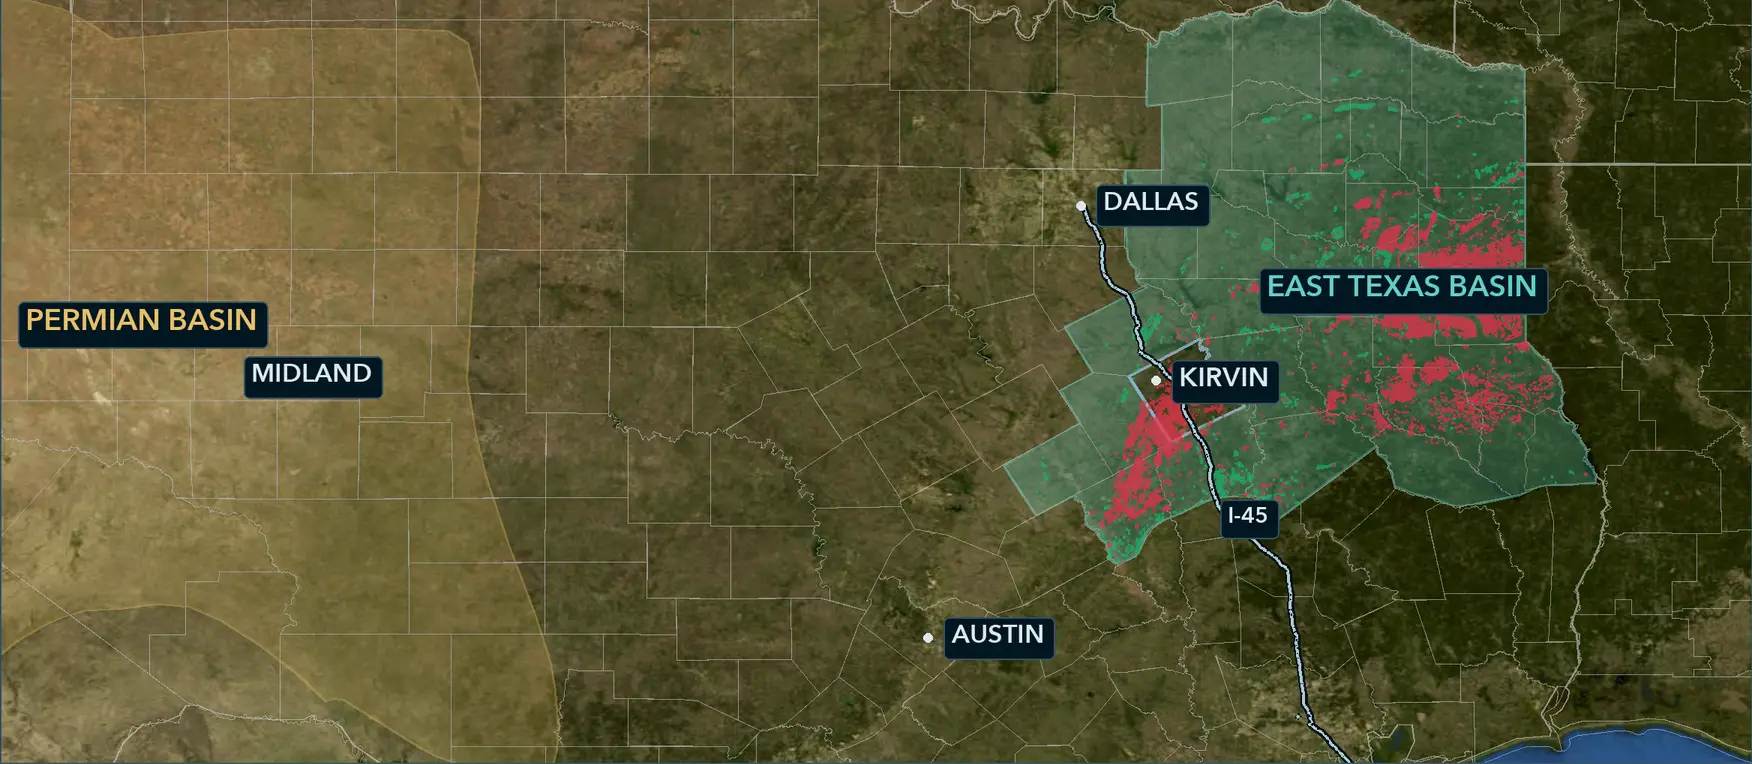
Southeast of Dallas, in the East Texas Basin, Kirvin / North Mann brings fourteen existing wellbores into one connected field. Scroll from the regional landscape into the wells at the center of the program.
01 / The East Texas BasinScroll to explore ↓
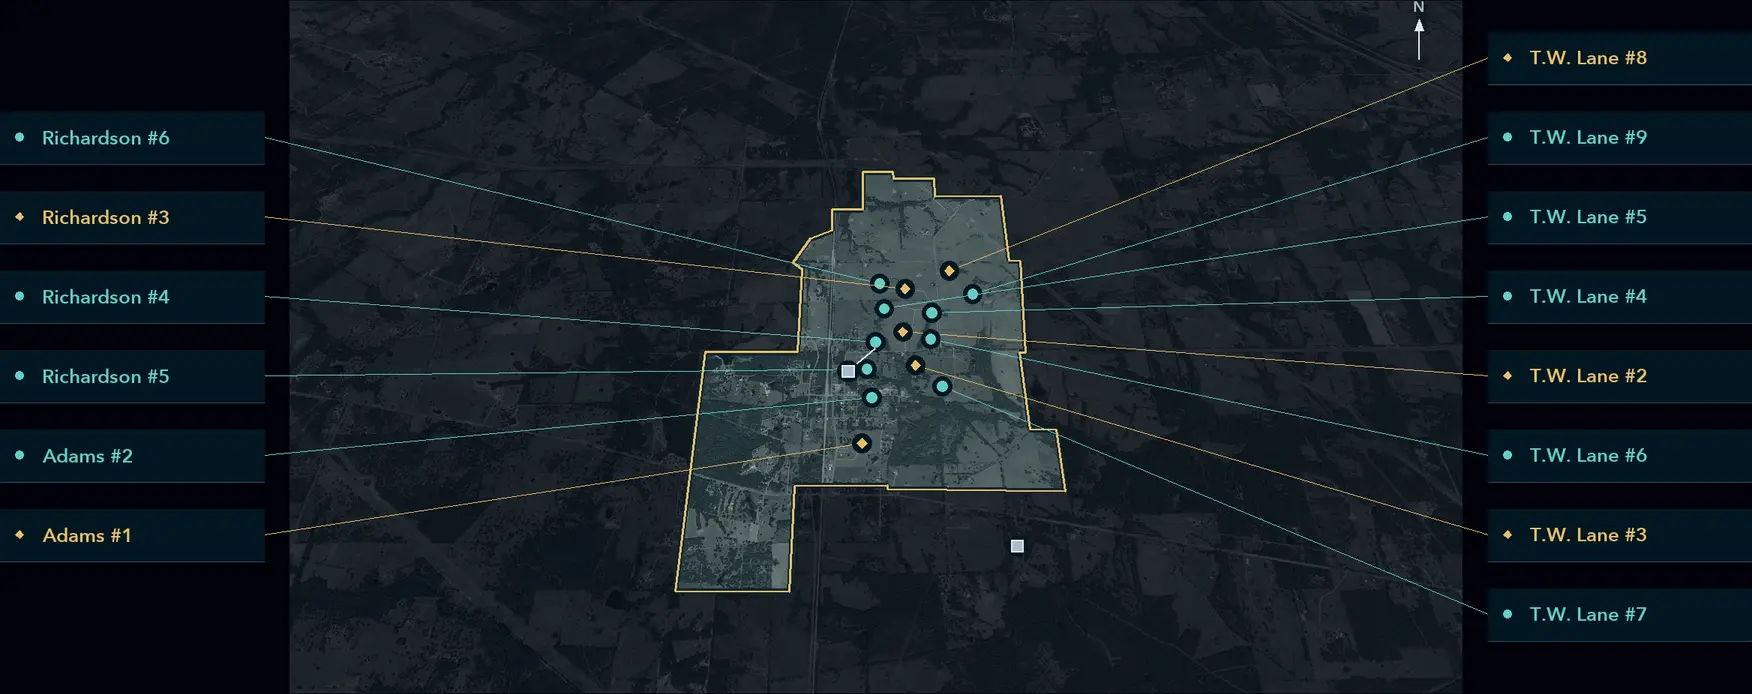
9 producing wells5 recompletions
From the basin to the wellbore. Follow the geography into the field.
Existing wellbores give the program its starting point.
Connected infrastructure gives the field its route to market.
The foundation · Assets on the ground
From the wellhead.
All the way to market.
The gathering system connects the wells to separation, storage, compression, dehydration and sales metering. Explore the equipment behind that route.
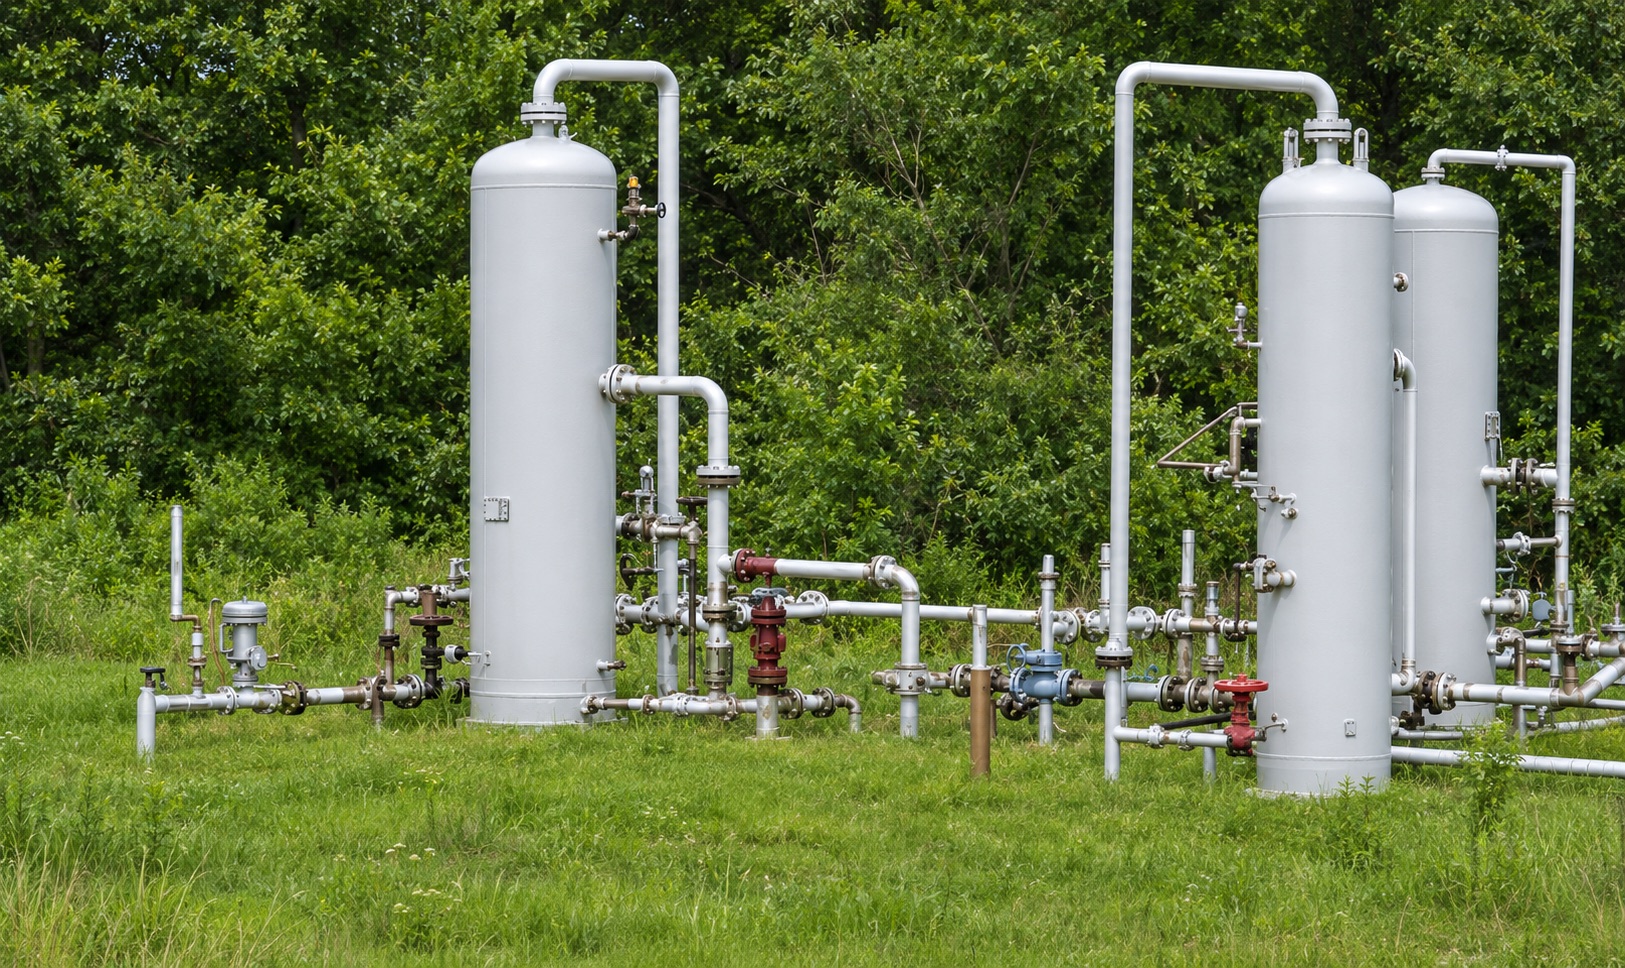
Separation equipment · Kirvin / North Mann
Separation
The first step at the surface. Separation equipment divides the produced stream into natural gas, oil and water.
Explore the field systems
GatherConnect production across the field.
SeparateHandle gas, oil and water.
ConditionCompress gas and remove moisture.
MeasureRecord gas at the sales connection.
The record · Before the next chapter
A producing history.
A field worth revisiting.
Developed by R. Lacy and Saint Mary’s, Kirvin has a production record that reaches well beyond its current output. Original completions, operating history and well logs inform the next stage of work.
~12 million
Mcf produced across the field
~16,500
Barrels produced
1,841
Mcf/day average initial gas rate per well across the fourteen original completions
Established wellbores
Original development created the wells and the operating record that anchor today’s technical evaluation.
AP acquires the field
AP Operating takes ownership and begins the next chapter at Kirvin / North Mann.
A connected program
Current production, existing infrastructure and targeted well work come together in the redevelopment plan.
The program · Two workstreams, one field
Build on production.
Open the next interval.
The initial program brings two complementary workstreams together: optimization across nine producing wells, alongside targeted workovers, recompletions and fracture stimulation across five additional wells.
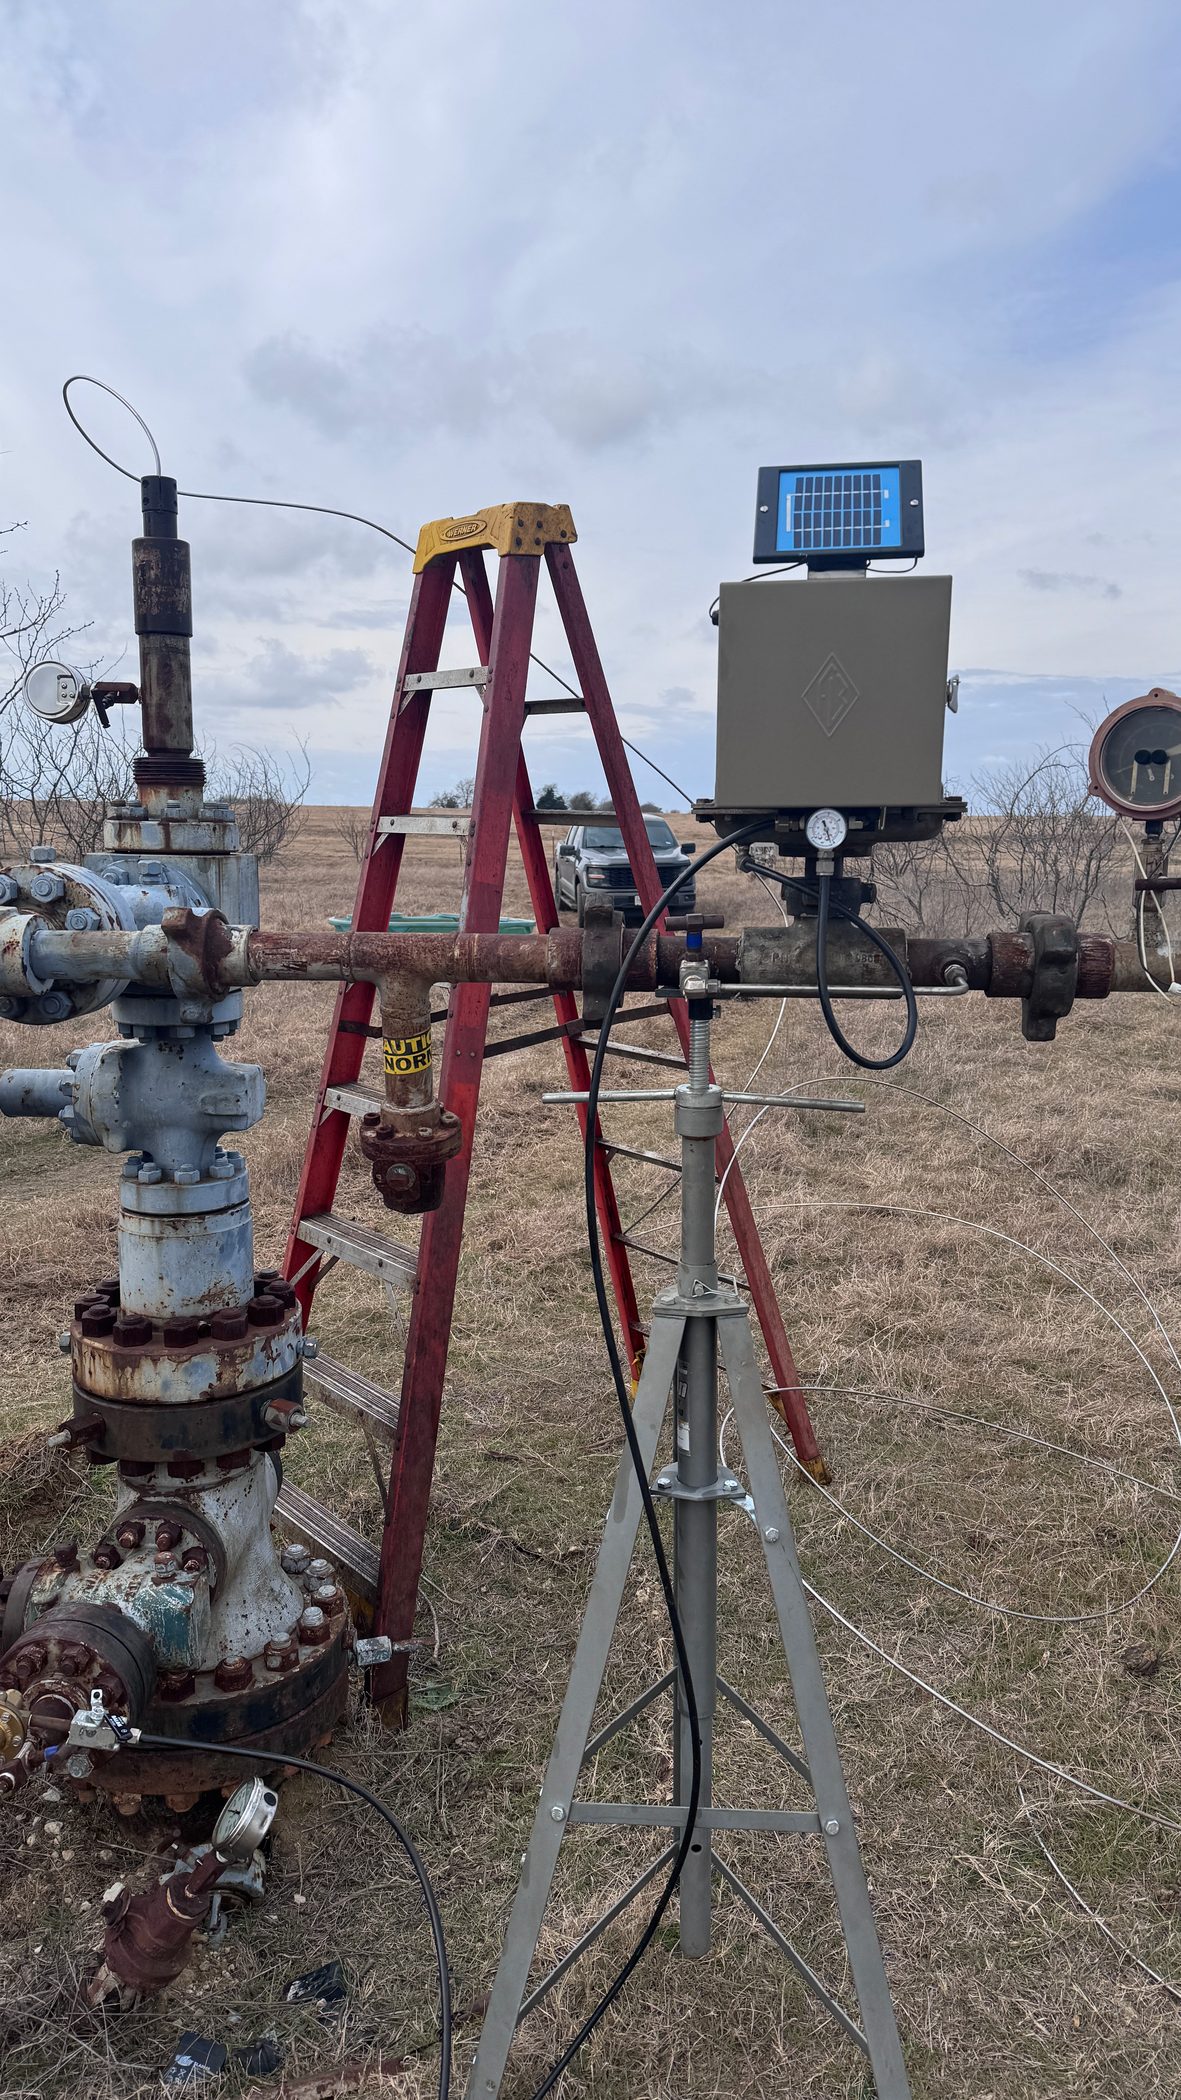
9Producing wells · optimization
Make the operating cycle work harder.
Well servicing, chemical treatment, upgraded controls and remote monitoring form the optimization program. Engineers can use well performance to refine operating cycles and automate the adjustments.
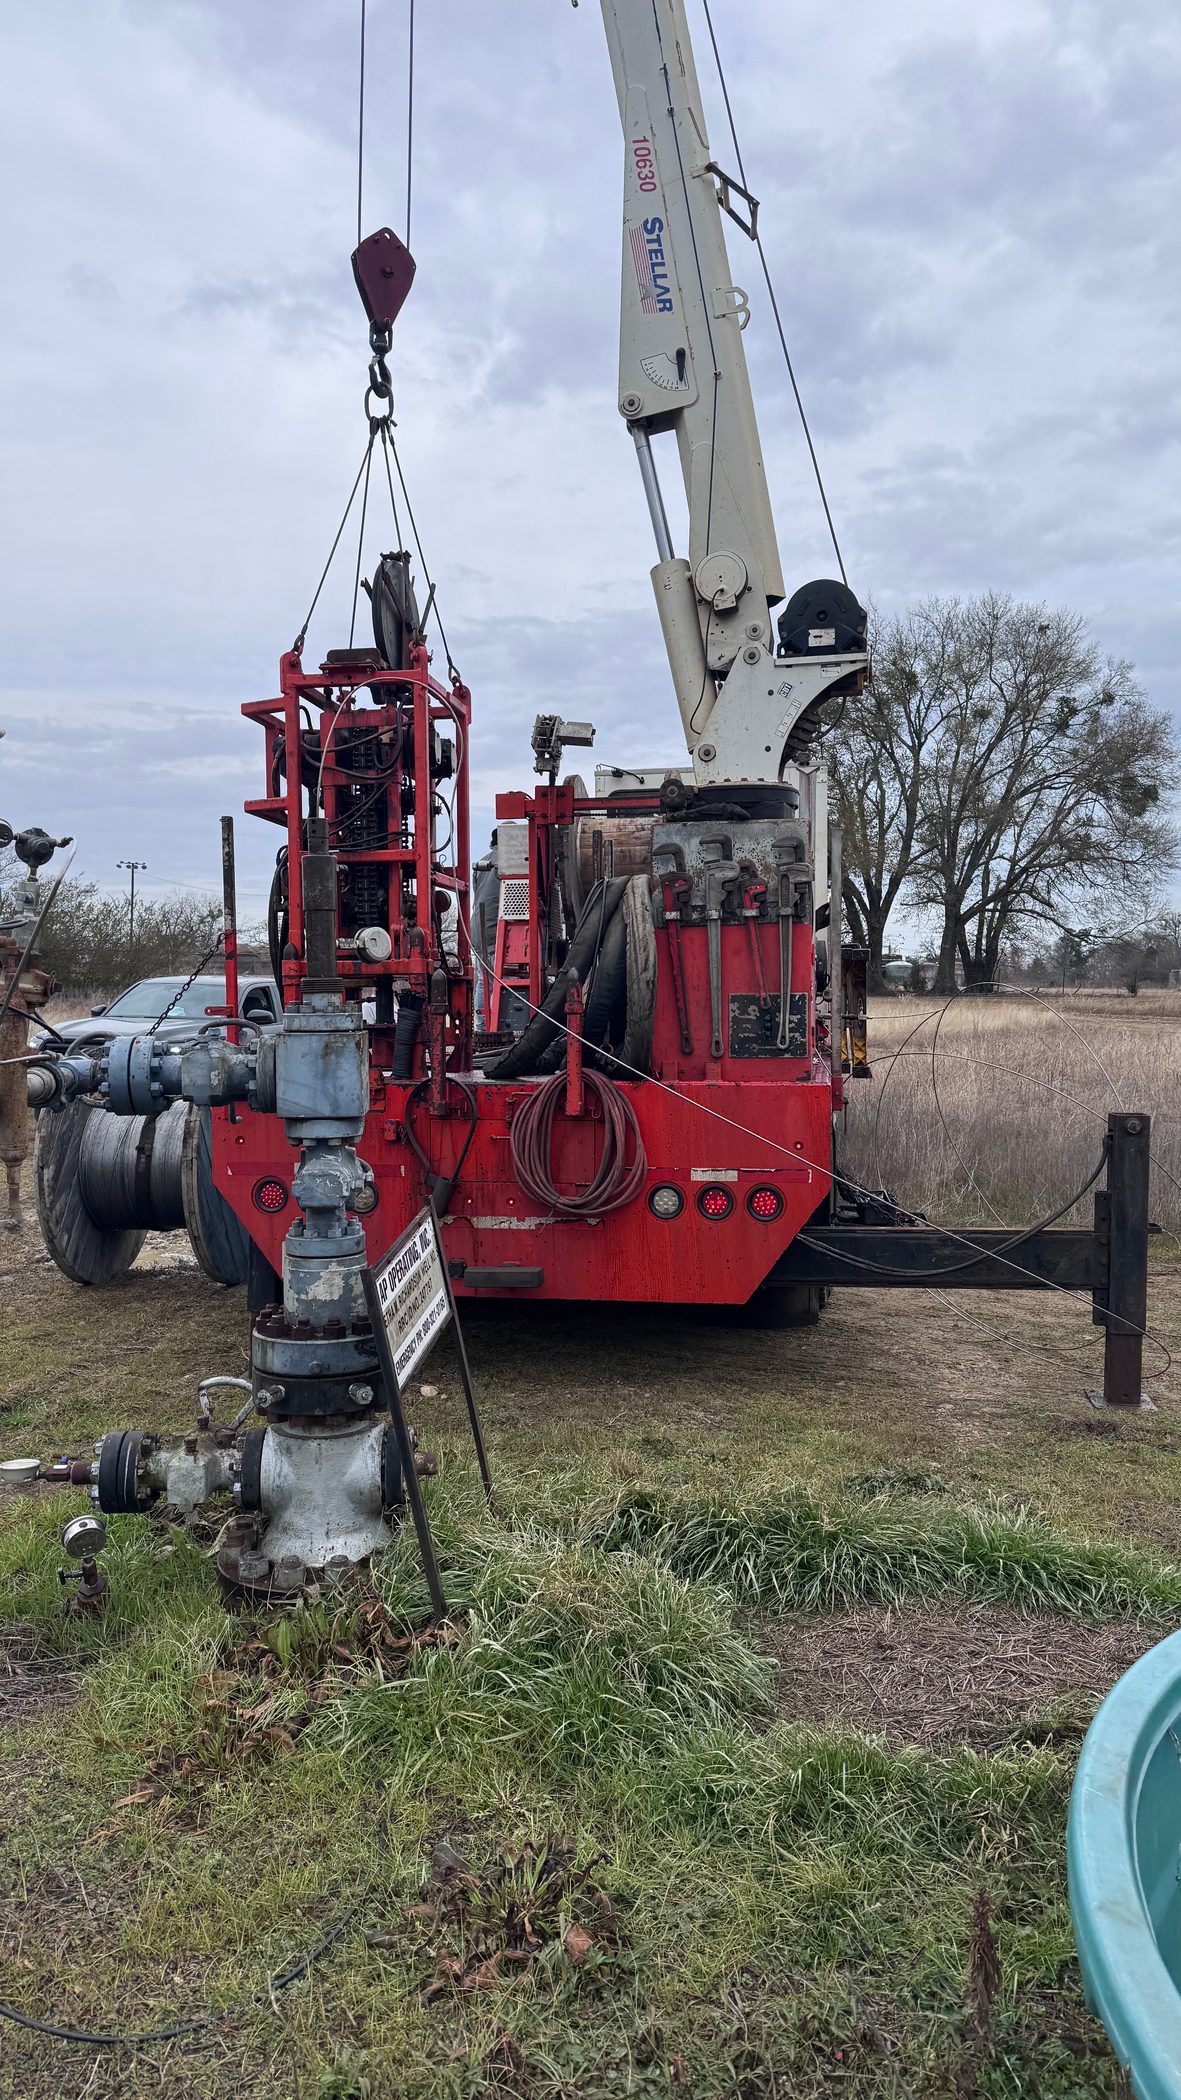
5Recompletions
Work through wells already in place.
The major workover program targets additional reservoir intervals through existing wellbores. Well logs and field history guide interval selection, followed by recompletion and fracture stimulation.
And beyond the initial program?
The field’s subsurface framework also informs future drilling evaluation. Additional development is a separate phase, shaped by geology, field results and its own work and capital plan. Explore our approach
The production story · From today to the target
Two workstreams.
A larger production ambition.
The program starts with 200+ Mcf/day of current gas production. Optimization targets the nine producing wells; recompletion and fracture stimulation across the five target wells pursue additional output from selected reservoir intervals.
01 / Nine producing wells
Optimization target
800 Mcf/dayTotal gas target for the nine wells
02 / Five recompletions
Recompletion & stimulation
Natural gas7,500–15,000Mcf / day
Crude oil150–300barrels / day
03 / Combined program
Initial production target range
Natural gas8,300–15,800Mcf / day · combined workstreams
Crude oil150–300barrels / day · five-well target
The five-well gas range uses 1,500–3,000 Mcf/day per well. Oil targets assume 20 barrels per 1,000 Mcf. Targets depend on successful interventions and fracture stimulation; actual rates, timing and decline may differ materially.
1,841 Mcf/dayHistorical average original IP per well
9,205 Mcf/dayFive-well equivalent at that average
Original average across 14 wells; the five-well equivalent is arithmetic context, not a forecast of recompletion performance.
Explore the model
Three full-field production scenarios
Base sensitivity case
7,900Mcf/day gas
154barrels/day oil
~28%
of modeled gross sales comes from oil at $3/Mcf gas and $60/barrel oil.
These cases test full-field output at 100%, 50% and 25% of the model’s upside case. They are sensitivity scenarios, separate from the workstream target range.
Actual production can fall outside these cases; the conservative case is not a minimum.
Participation · A shared stake in Kirvin
Fourteen wellbores.
One shared commitment.
A working interest in the Kirvin program spans all fourteen existing wellbores. Optimization, targeted workovers, recompletions and fracture stimulation are part of the same redevelopment story.
AP Operating retains a 25% working interest. Participants hold direct working interests in the fourteen existing wellbores. Select a unit size to see the ownership and estimated routine operating allocation.
Explore participationChoose your participation
$65,000Quarter unit
- Working interest
- 1.00%
- Net revenue interest
- 0.75%
- Est. monthly LOE · deducted from distributions
- $140
Net revenue interest reflects the 25% mineral royalty, before operating costs, taxes and other deductions. LOE uses a $14,000 monthly field budget; actual expenses vary. Capital work and other agreement charges are separate.
Discuss this interestFor verified accredited investors · Regulation D, Rule 506(c)
Production into perspective
Follow the production.
See your share.
Explore the program’s production cases, modeled sales and the economics of your selected interest. Change the case, unit size or commodity prices to see what moves.
Production sensitivity model
Selected investment
Explore production, deductions & prices
01 / Field production & sales
Gas Oil
02 / Your selected interest
- Your working-interest share of gross sales
- Mineral royalty allocation
- Modeled production taxes
- Est. monthly LOE · deducted from distributions
Model assumptions & what the result includes
Monthly figures use a 30.4-day month, 25% mineral royalty, 7.5% gas production tax, 4.6% oil production tax and a $14,000 monthly field operating budget. Prices are adjustable assumptions. Royalties reduce revenue interest; operating costs follow working interest.
Monthly operating cash is before investor income tax, additional capital, operator charges, reserves and other deductions that may apply. Actual distributions also depend on receipts and payment timing. The cumulative view deducts royalties and production taxes, but excludes lifetime operating and capital costs because a timed cost schedule is not part of this model.
These are sensitivity cases, not probabilities or minimum outcomes. Cumulative volumes have no specified recovery horizon. Actual production, prices and costs can fall outside the cases. Oil quantities are modeled field volumes, not a statement of current oil production.
Your capital · Your structure
More than one way
into the field.
Choose a path to explore how ownership, production revenue and tax treatment connect to your investment structure.
The next step
Discuss this ownership routeOwnership
14 wellbores.Your working interest.
Income & tax destination
How this route works
Participation is for verified accredited investors. The purchaser’s structure, account rules and offering documents determine eligibility.
The first-year tax opportunity
Put your capital to work.
Plan for the deduction.
For qualifying taxable investors, AP expects first-year deductions equal to 100% of invested capital, based on the program’s planned qualifying development, equipment and operating expenditures.
100%AP’s expected first-year deduction
A deduction from taxable income.
Not a tax credit or cash refund.
Beyond project incomeWhere the deduction
Where the deduction
can make a difference.
Intangible costs
Eligible intangible drilling and development expenditures may be elected for current deduction rather than capitalized.
Accelerated depreciation
Qualifying equipment acquired and placed in service after January 19, 2025 can receive 100% first-year bonus depreciation, subject to the eligibility rules.
Depletion
Eligible owners may claim depletion as the field produces. Percentage depletion is generally 15% of qualifying gross property income for eligible independent producers and royalty owners, subject to limits.
The amount and timing you can use depend on actual spending, cost classification, ownership structure and your tax position. Offsetting income outside the project requires applicable nonpassive treatment; basis, at-risk and excess business loss limits can defer deductions. Retirement accounts and 1031 exchanges follow different rules.
Explore the tax framework by cost and ownership structure
Operating costs
Ordinary and necessary operating expenses are evaluated under IRC §162(a); acquisition and capital costs are treated separately.
Deduction limits
The working-interest exception depends on how the interest is held. Basis, at-risk and excess business loss rules can limit a current deduction; partnership and S corporation owners also have entity-specific basis limits.
Trusts & entities
Grantor-trust rules determine whether items belong to the grantor. Partnership and S corporation rules govern qualifying pass-through items; corporations generally claim their own deductions. Entity liability limits can affect working-interest treatment.
Retirement ownership
Traditional, Roth and SEP accounts follow their own tax rules. Project deductions stay with the account; operating income may create UBTI, and prohibited transactions must be avoided.
Like-kind exchanges
The assigned real-property interest must qualify, exchange deadlines apply, and basis generally carries over. A qualifying exchange does not automatically create a new deduction equal to the subscription price.
Beyond the initial program
A field with history.
Room for another chapter.
The initial work is the beginning of AP’s field strategy: establish production response, evaluate new locations and use the results to shape a broader development and potential sale opportunity.
The platform for what comes next~2,200contiguous field acres
One connected field.
Multiple reservoir horizons.
Fourteen existing wellbores, established gathering and stacked reservoir intervals give AP a platform for redevelopment—and a starting point for evaluating where new drilling could add value.
Rodessa / SligoPettetTravis PeakCotton Valley
01 / Let the reservoir guide the capitalMore than a map.
More than a map.
A framework for the next well.
The Cotton Valley study connects well logs, net-pay interpretation and reservoir assumptions to a larger development question: where should AP look next, and what must the next well prove?
Cotton Valley net-pay interpretation · November 2021
The ~64.1 Bcf estimate covers the broader reservoir study area, not just the ~2,200-acre operating footprint or the offered wellbore interests. It is a volumetric estimate, not booked proved reserves, and is separate from the initial program’s recovery cases.
02 / Two development pathsMore locations.
More locations.
Or more reservoir contact.
Vertical infill and horizontal development answer different questions. The study helps focus the candidates; engineering and field results determine which path earns the capital.
03 / The sequence mattersIncrease production.
Increase production.
Inform the next decision.
Redevelop
Optimize the nine producing wells and execute the five targeted interventions.
Validate
Use measured well response and the reservoir study to refine the next locations.
Develop
Advance selected vertical or horizontal wells through their own engineering and capital plan.
Evaluate
Use the operating record to assess continued development or a potential strategic field sale.
New drilling is a separate development phase with its own technical evaluation, approvals, capital plan and participation terms. The initial subscription covers the specified existing wellbores; it does not automatically convey interests in new wells.
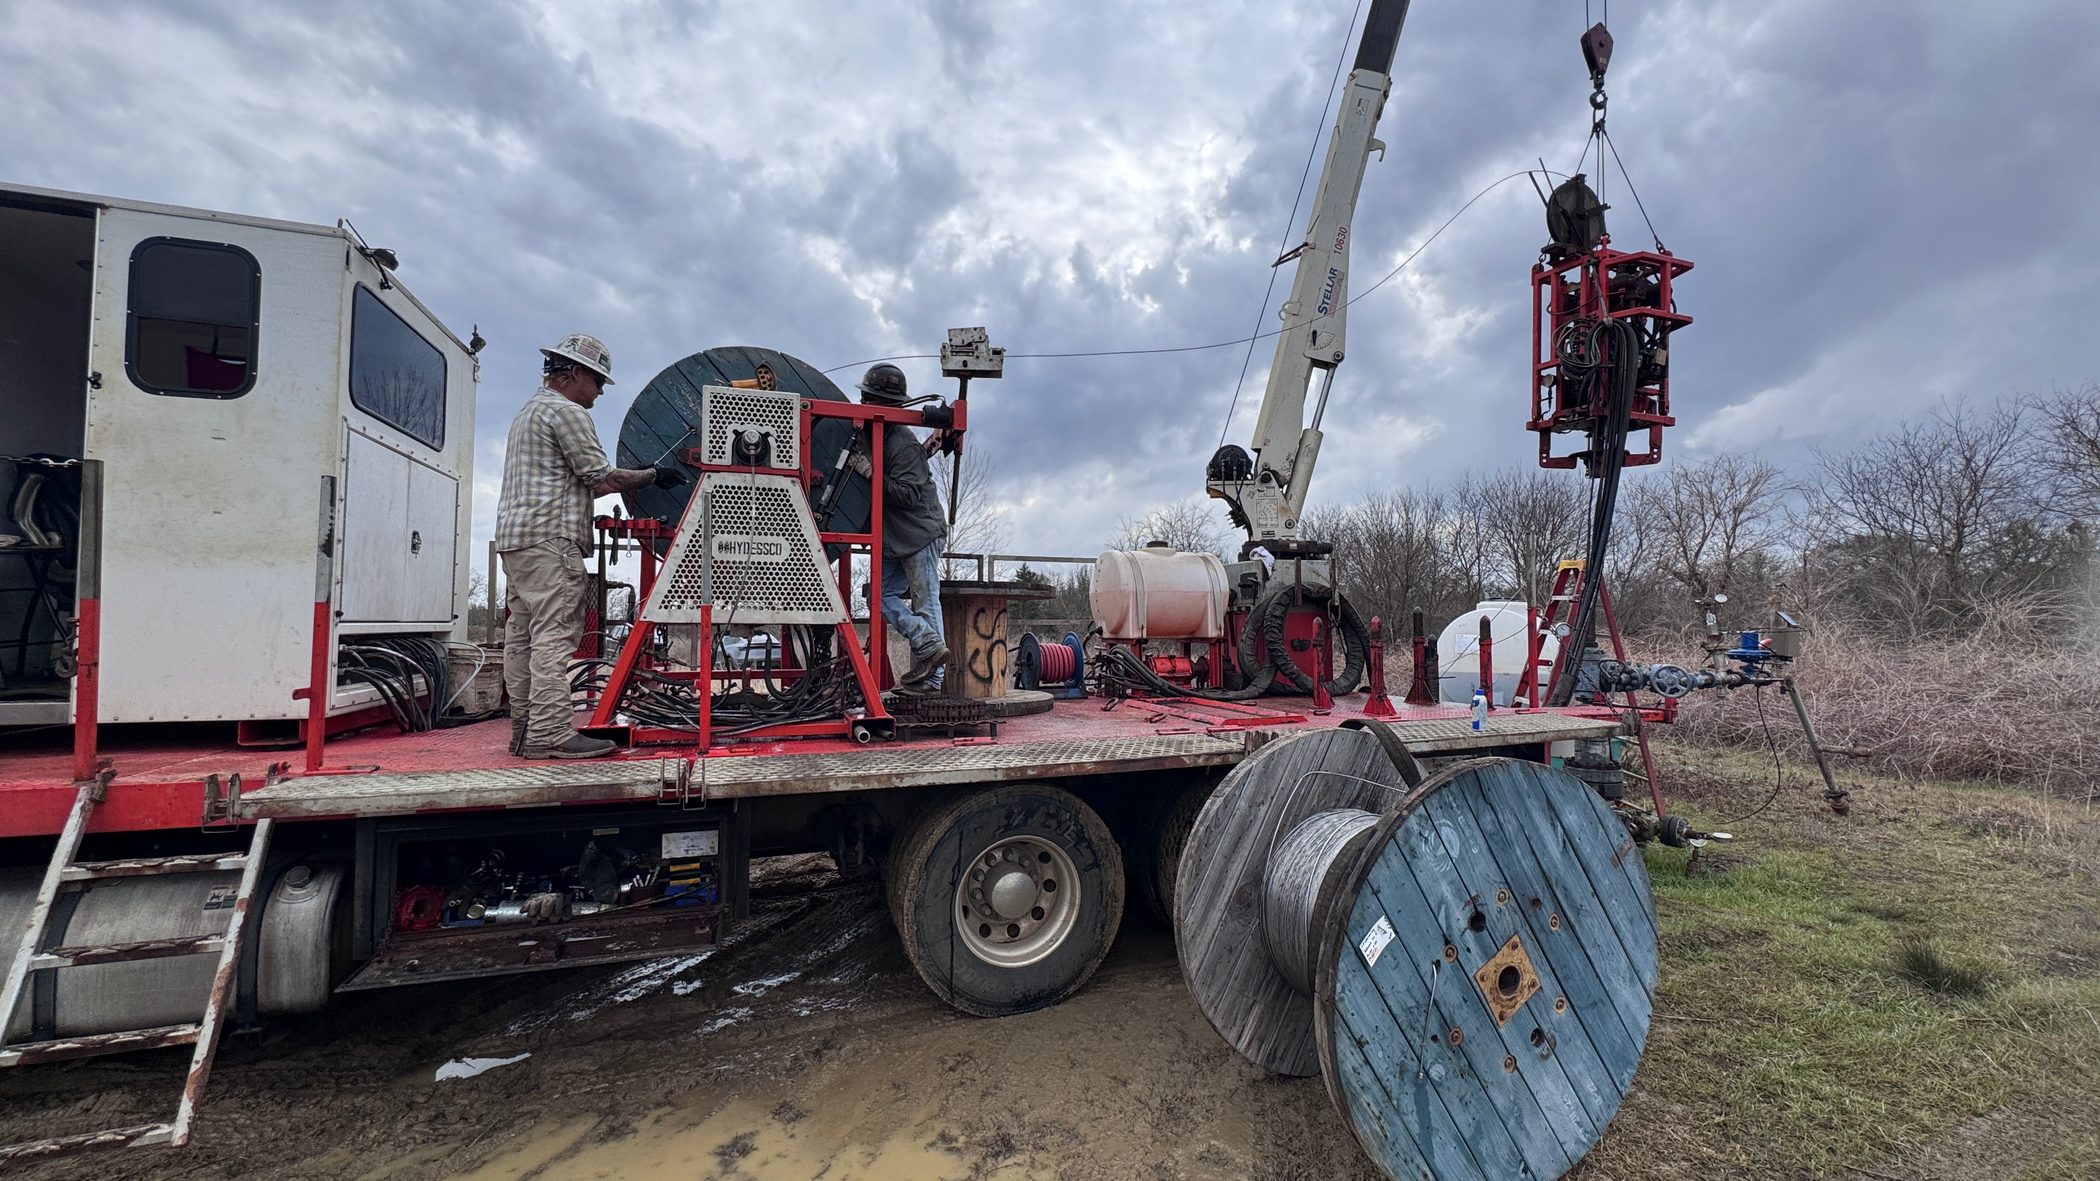
The work · Kirvin on the ground
The story moves
with the work.
Crews, equipment and decisions at the wellsite bring the field plan into action. Take a closer look at service activity from Kirvin.
The operator · AP Operating
A field needs a plan.
A plan needs people.
AP Operating brings business leadership and specialist experience across geology, engineering, completions, land and field operations to the Kirvin redevelopment program.
Connect well logs, production history and the condition of the assets to the scope of work.
Coordinate optimization, workovers and technical evaluation across the field.
Bring field observations and engineering input back into the next operating decision.
The next conversation
See the field.
Discuss your place in it.
Talk directly with AP Operating about the redevelopment program, working-interest participation and the project information available for your review.
Get the investor packageTony Tomlinson · Owner & Managing Director